
Case Study
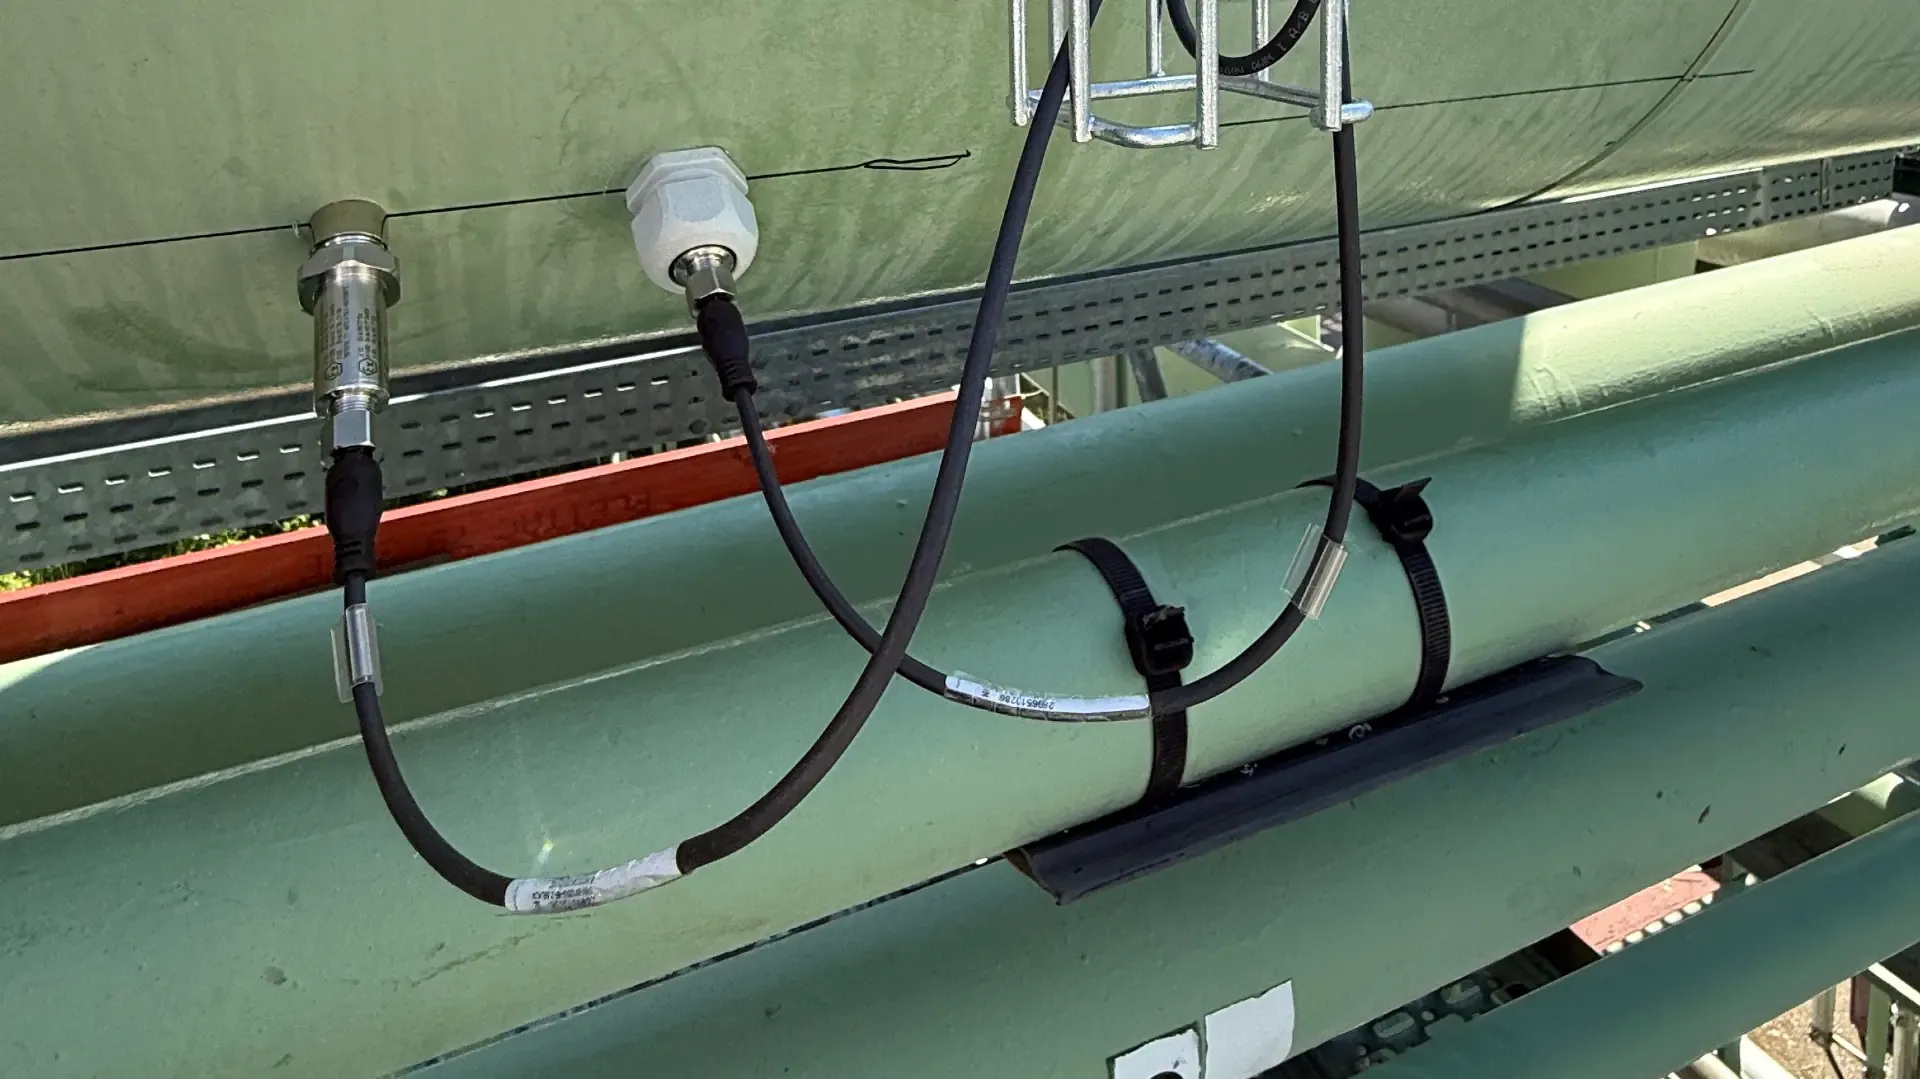
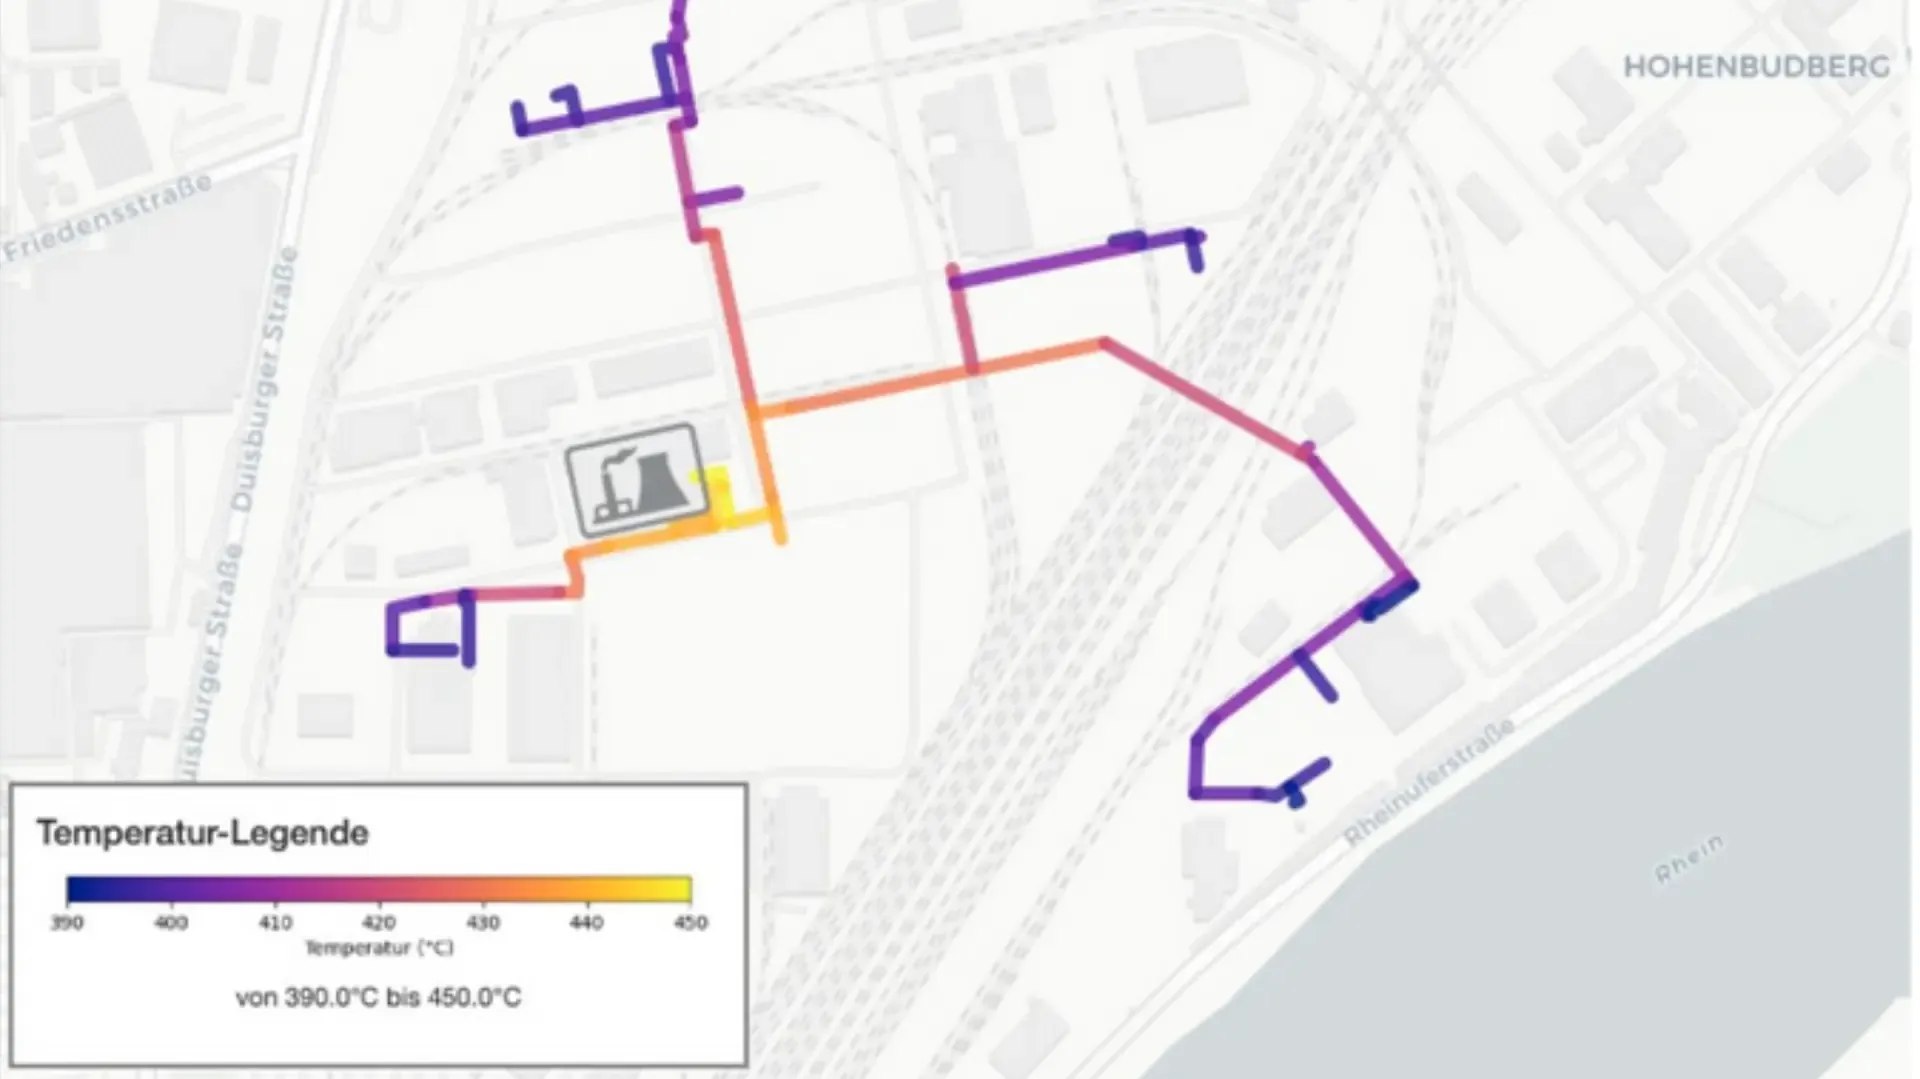
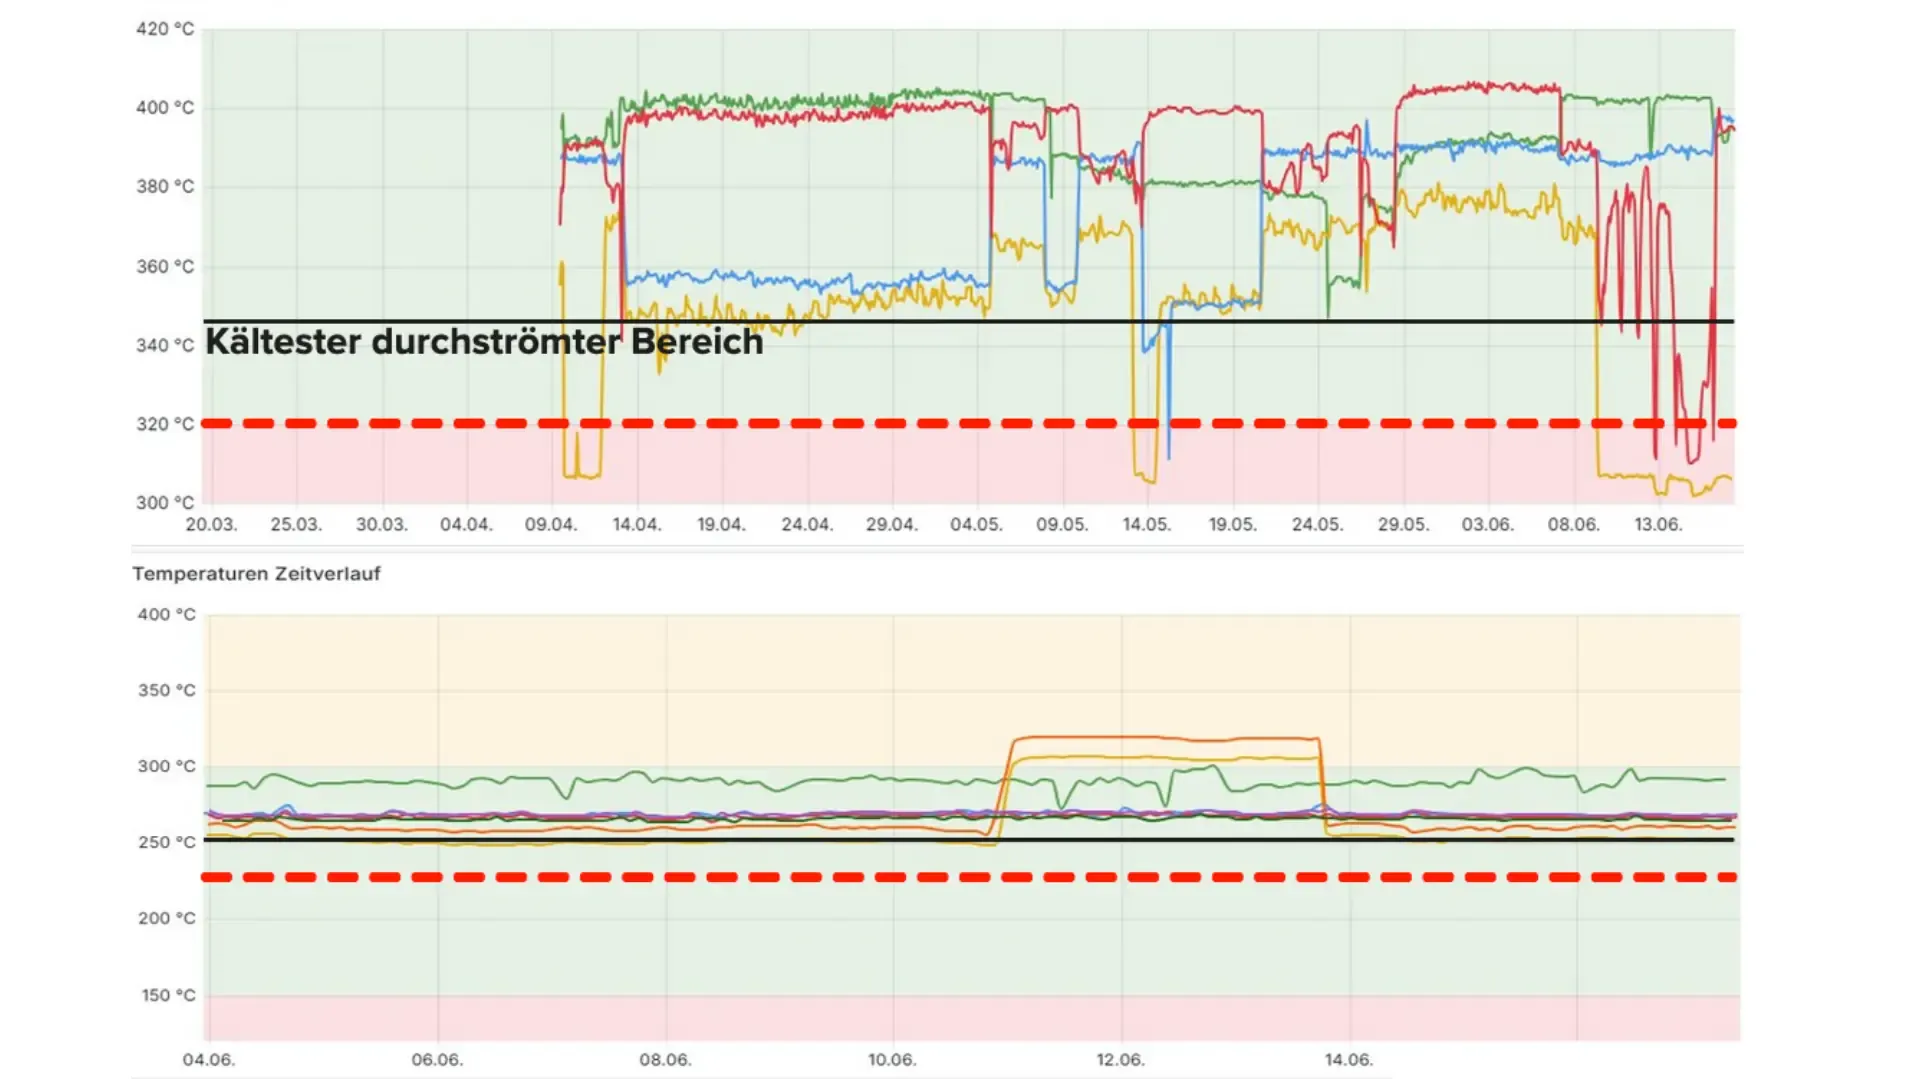
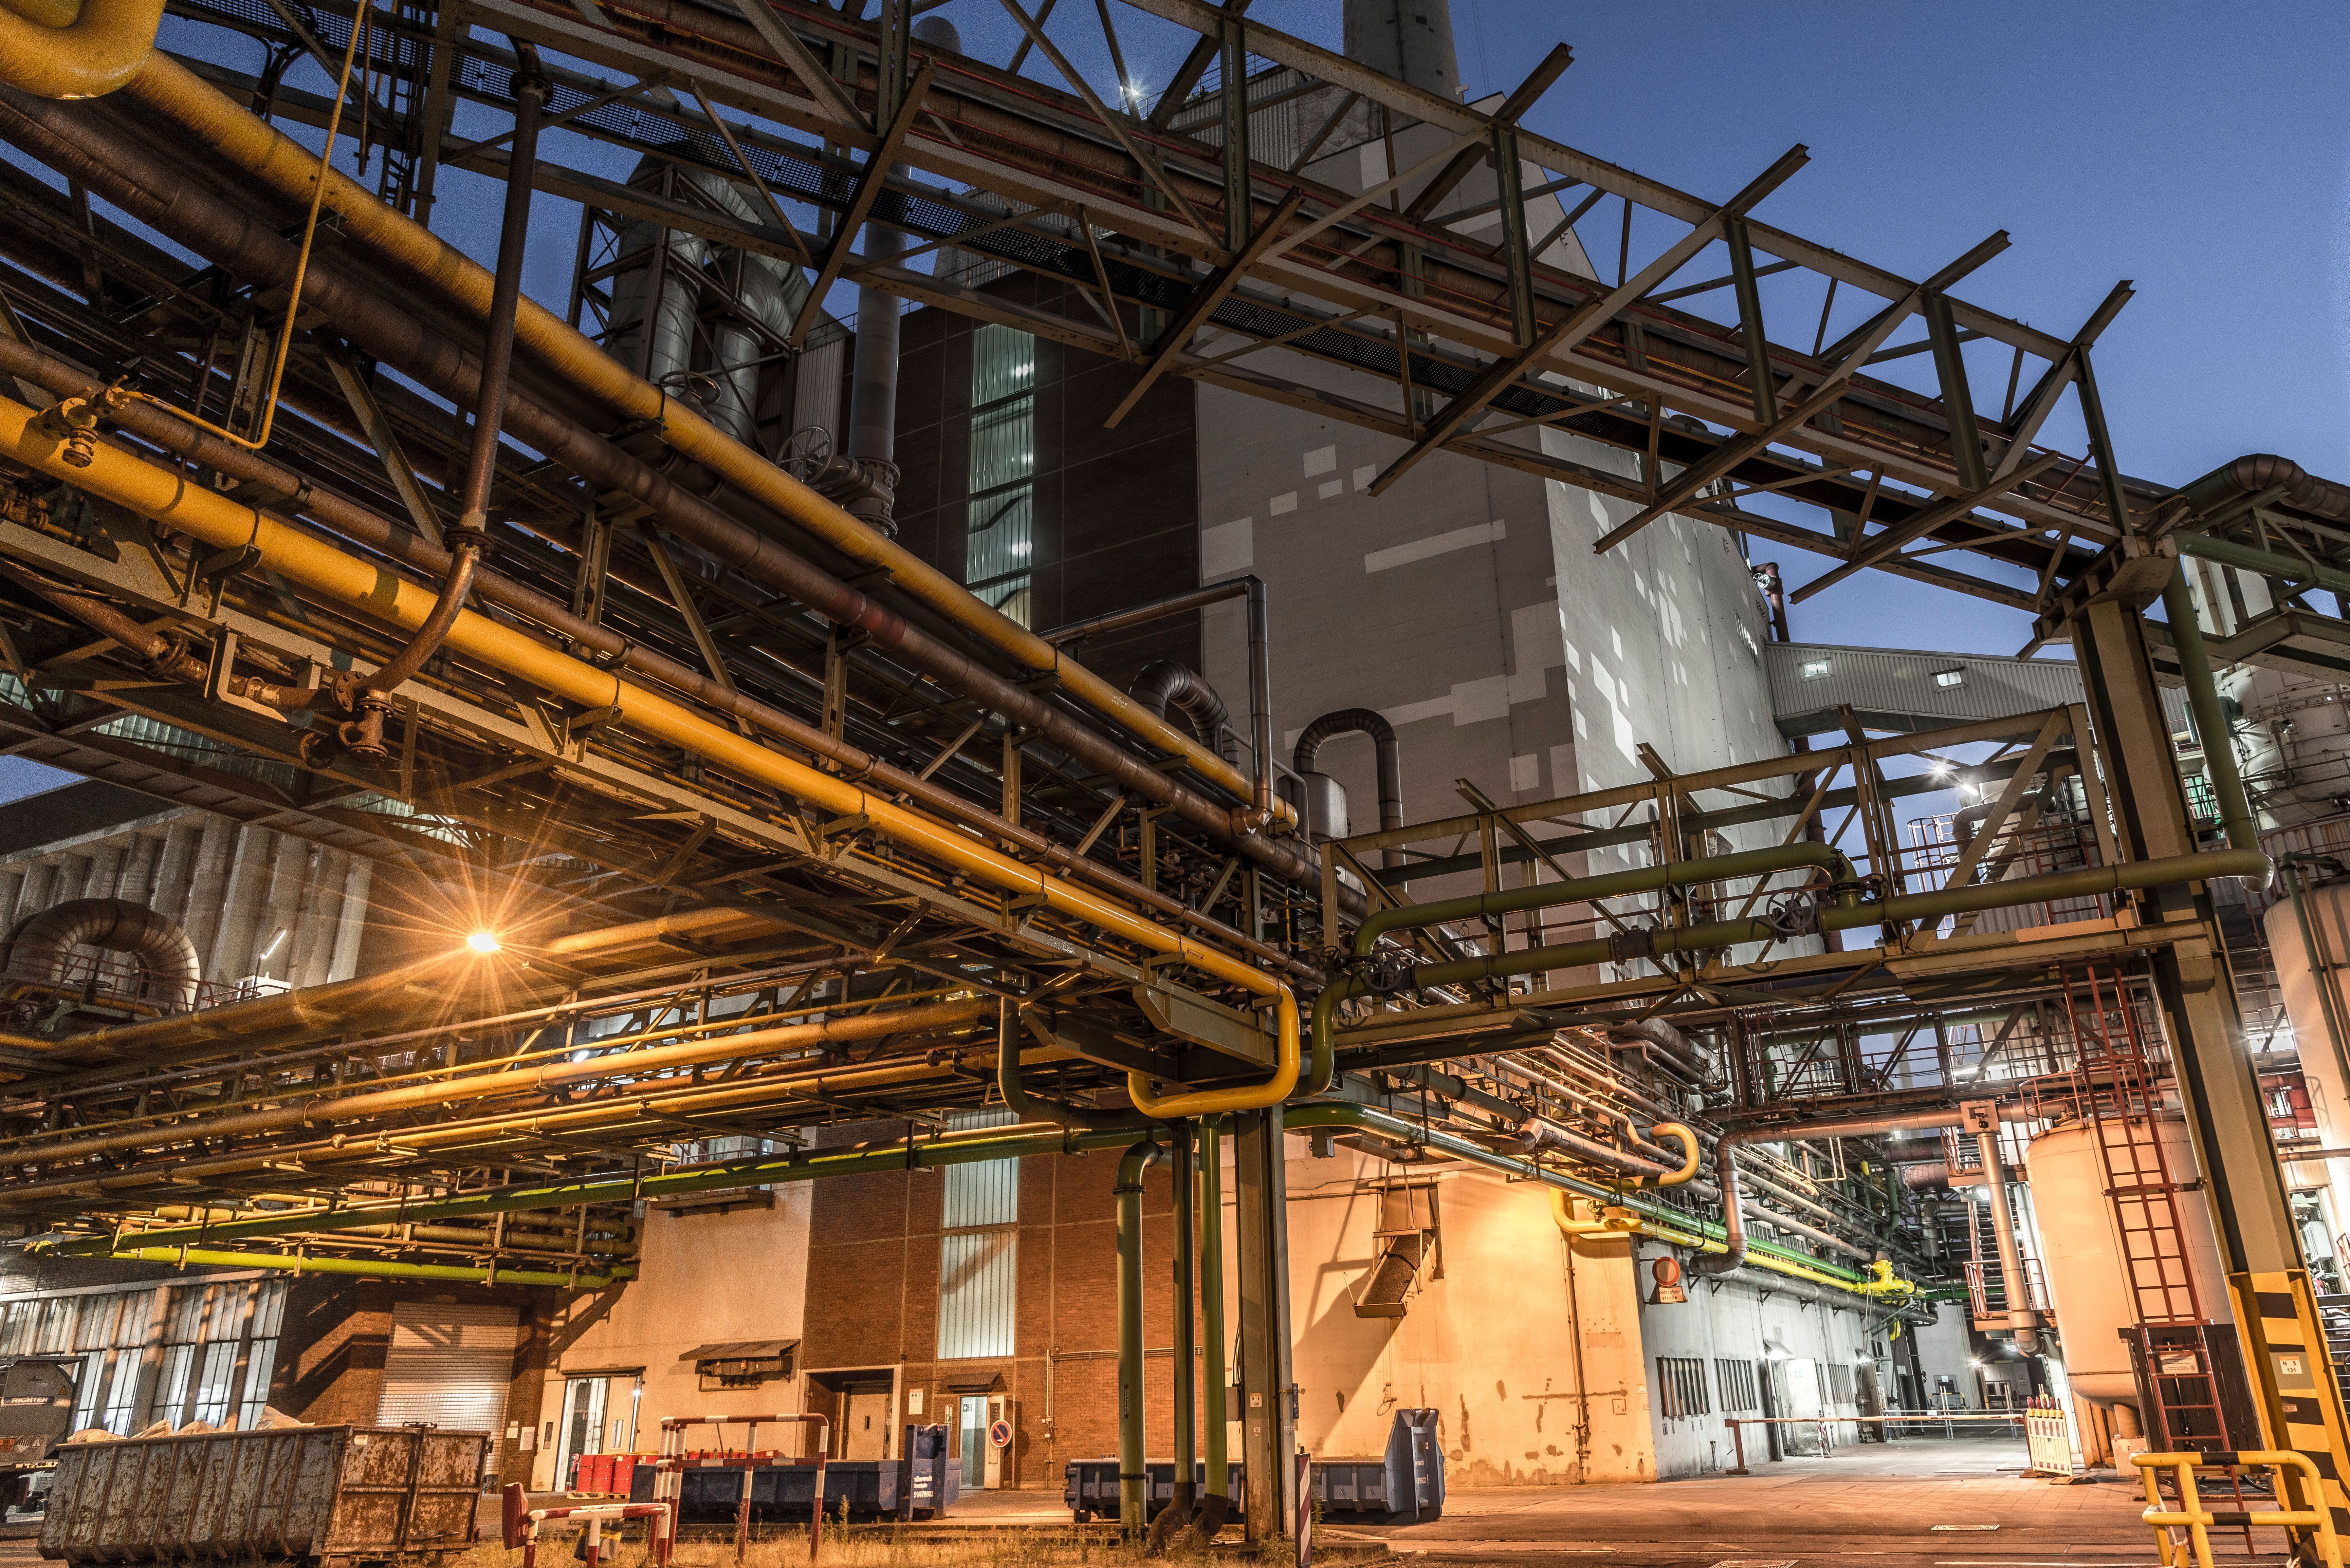
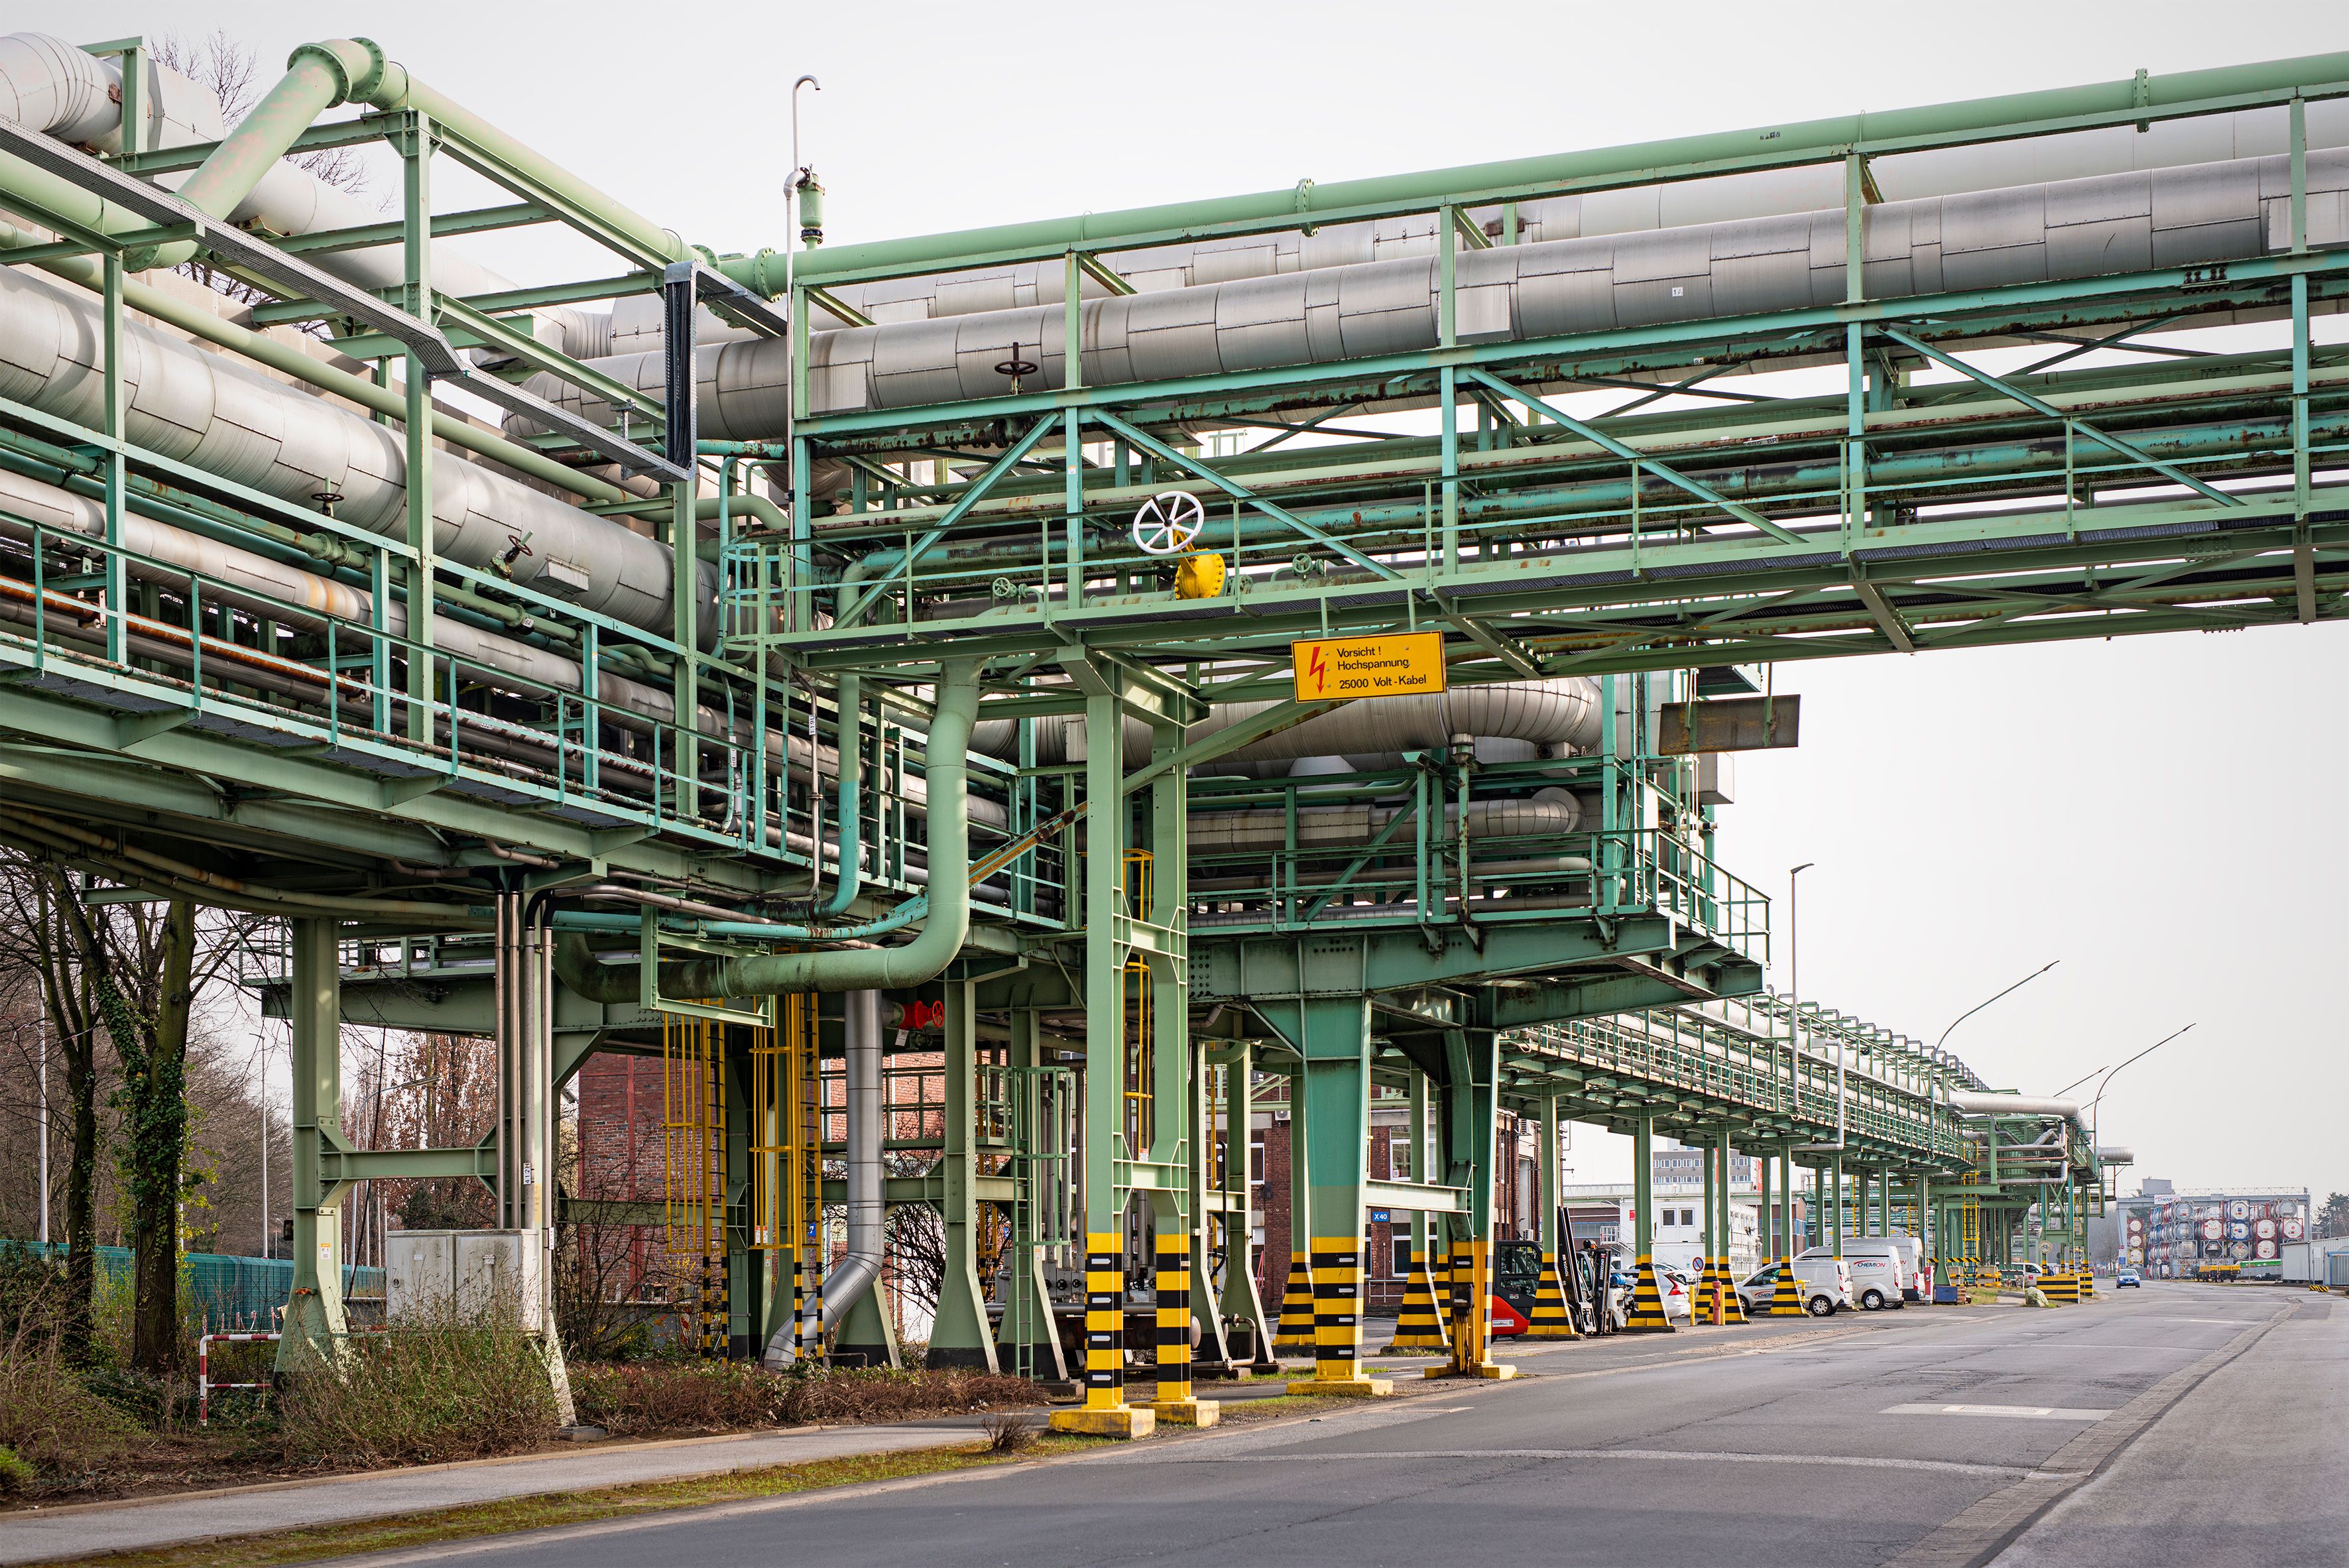
Steam Pipe Monitoring
CURRENTA expects to save up to 1.6 million euros annually through the use of a digital twin for its steam networks
IndustriesChemistryPharmaceuticals
Use CaseEnergy Monitoring
Related IoT SolutionsSteam Pipe Monitoring