

Case Study
Smart Heating
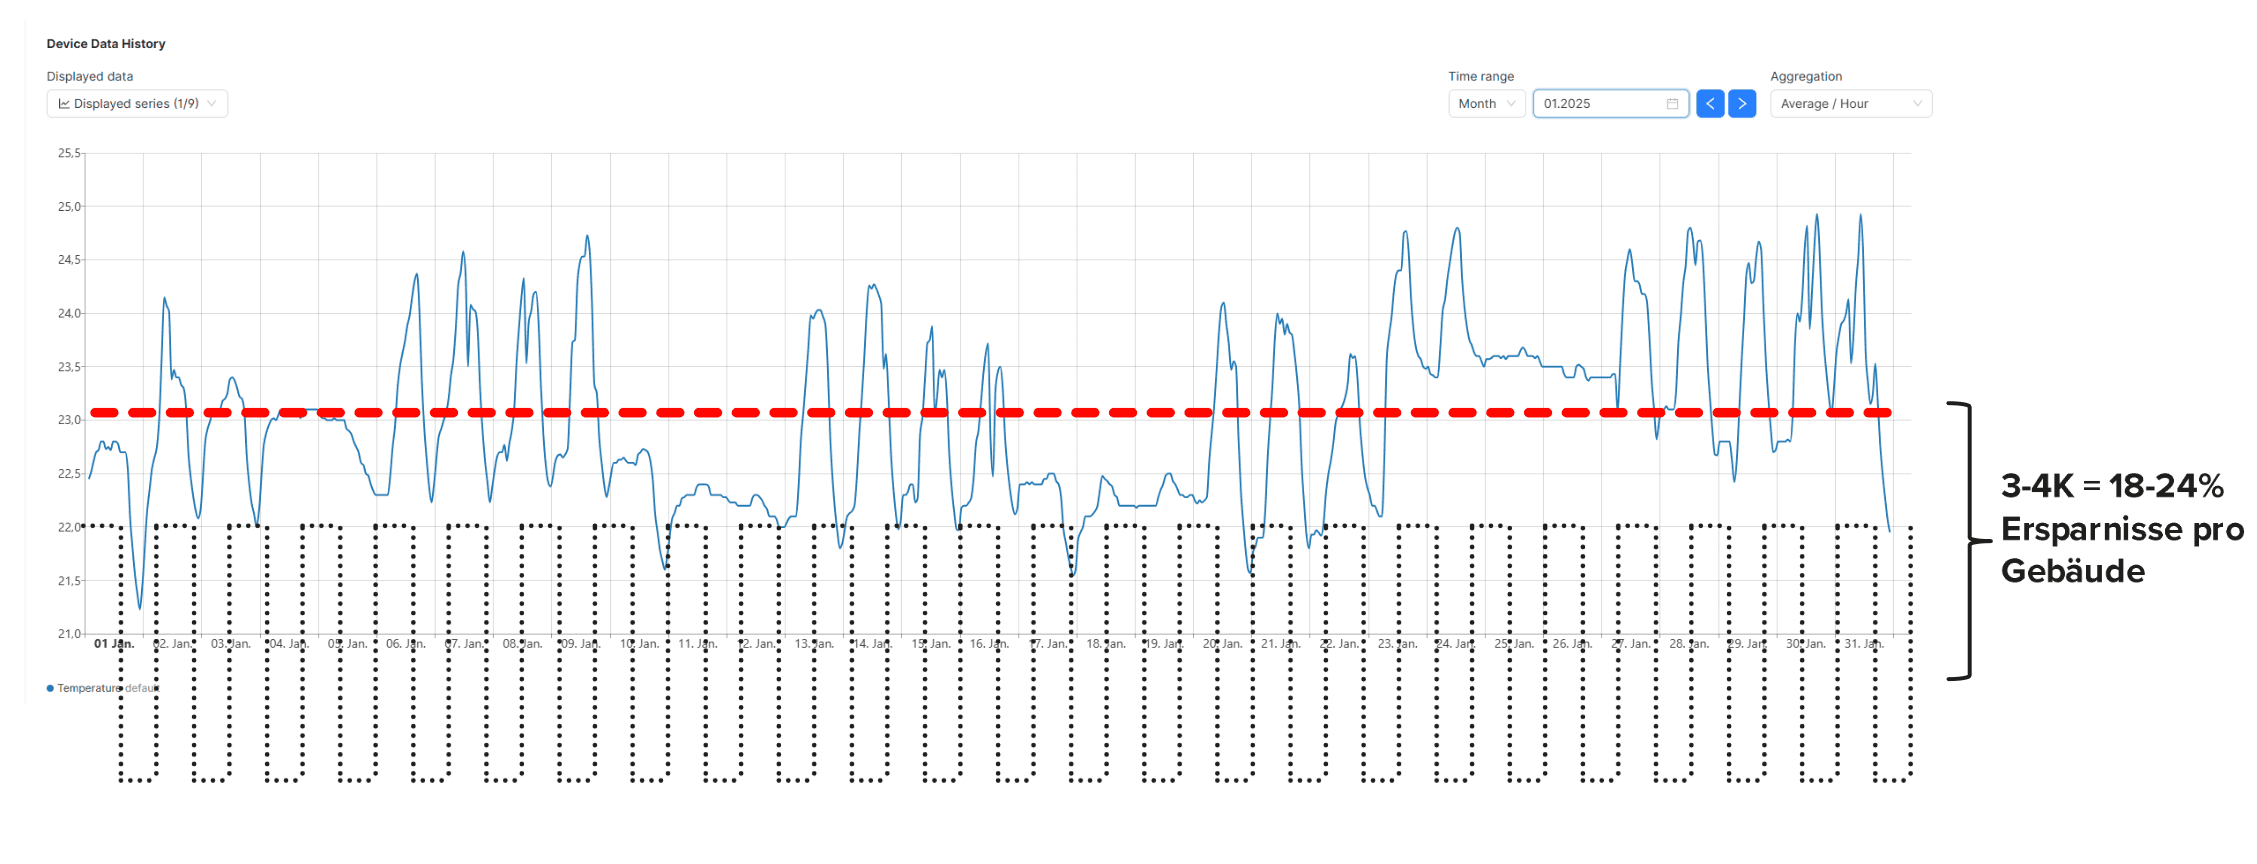
CURRENTA saves up to 30% on heating energy per year
Related IoT SolutionsSmart Heating
Challenge
Chronically excessive setpoint temperatures and energy consumption due to unregulated, inefficient building heating systems and the resulting CO₂ emissions
Solution
LoRaWAN-enabled sensors, digital heating curve control, and a central dashboard for visualization
Highlights
In a 300-square-meter office building owned by CURRENTA, the heating system was running at a high setting regardless of actual room usage or the outside temperature. This was due to a lack of transparency regarding room usage, air quality, and energy consumption.
Achieve sustainability goals through heating optimization and air quality tracking in just two weeks.
Together, we'll tailor the application to your needs.
 Murat Mutlu, Solution Portfolio Manager