In building operations, this is often exactly where things get stuck: heating data is scattered, meter readings are recorded manually, temperature curves are missing or usage times are only estimated. This costs time, complicates audits and makes it difficult to demonstrably prove improvements.
Especially in industrial areas, office buildings and existing buildings, heating is a major lever. At the same time, its operation often remains largely non-transparent. A monthly consumption value shows how much energy was used. However, it does not explain whether rooms are too warm at night, whether vacant areas continue to be heated, or whether a night setback is actually effective. For effective ISO 50001 energy management, this view is often not enough.
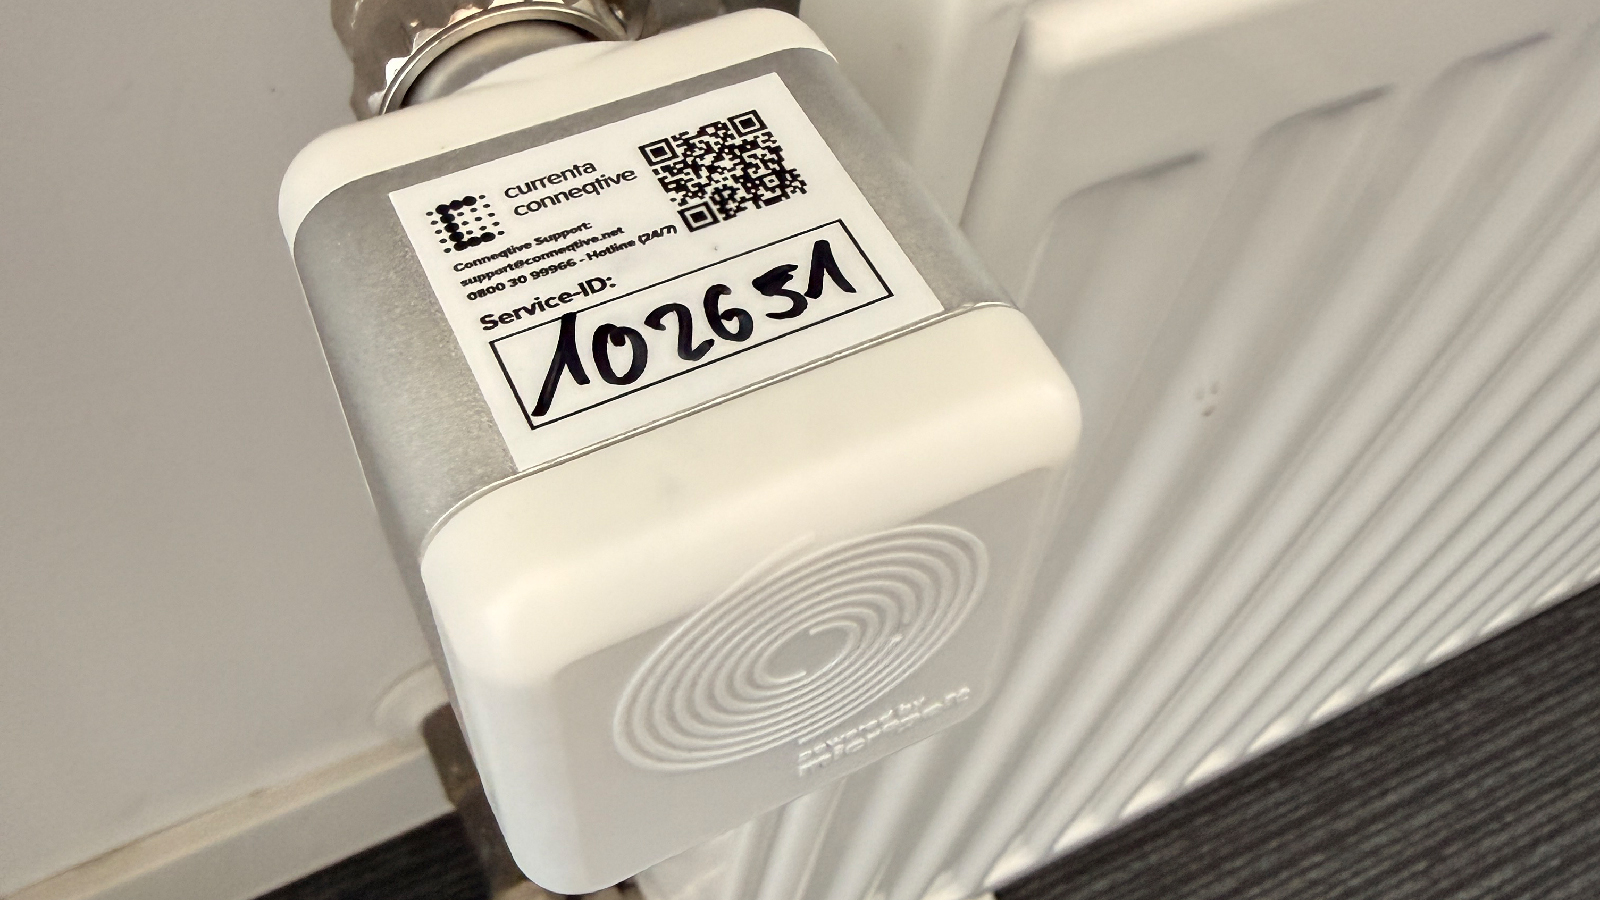
Smart Heating creates a better foundation when Conneqtive combines sensors, connectivity, data platform and operations as a Managed Service. Digital sensors continuously capture consumption, temperature and usage data. This creates real-time energy data that relieves energy, environmental and facility teams in their daily work. Individual measurements become an operational picture: Building C regularly falls out of line on Mondays, wing B continues to heat despite being vacant, and the next review no longer starts from scratch.
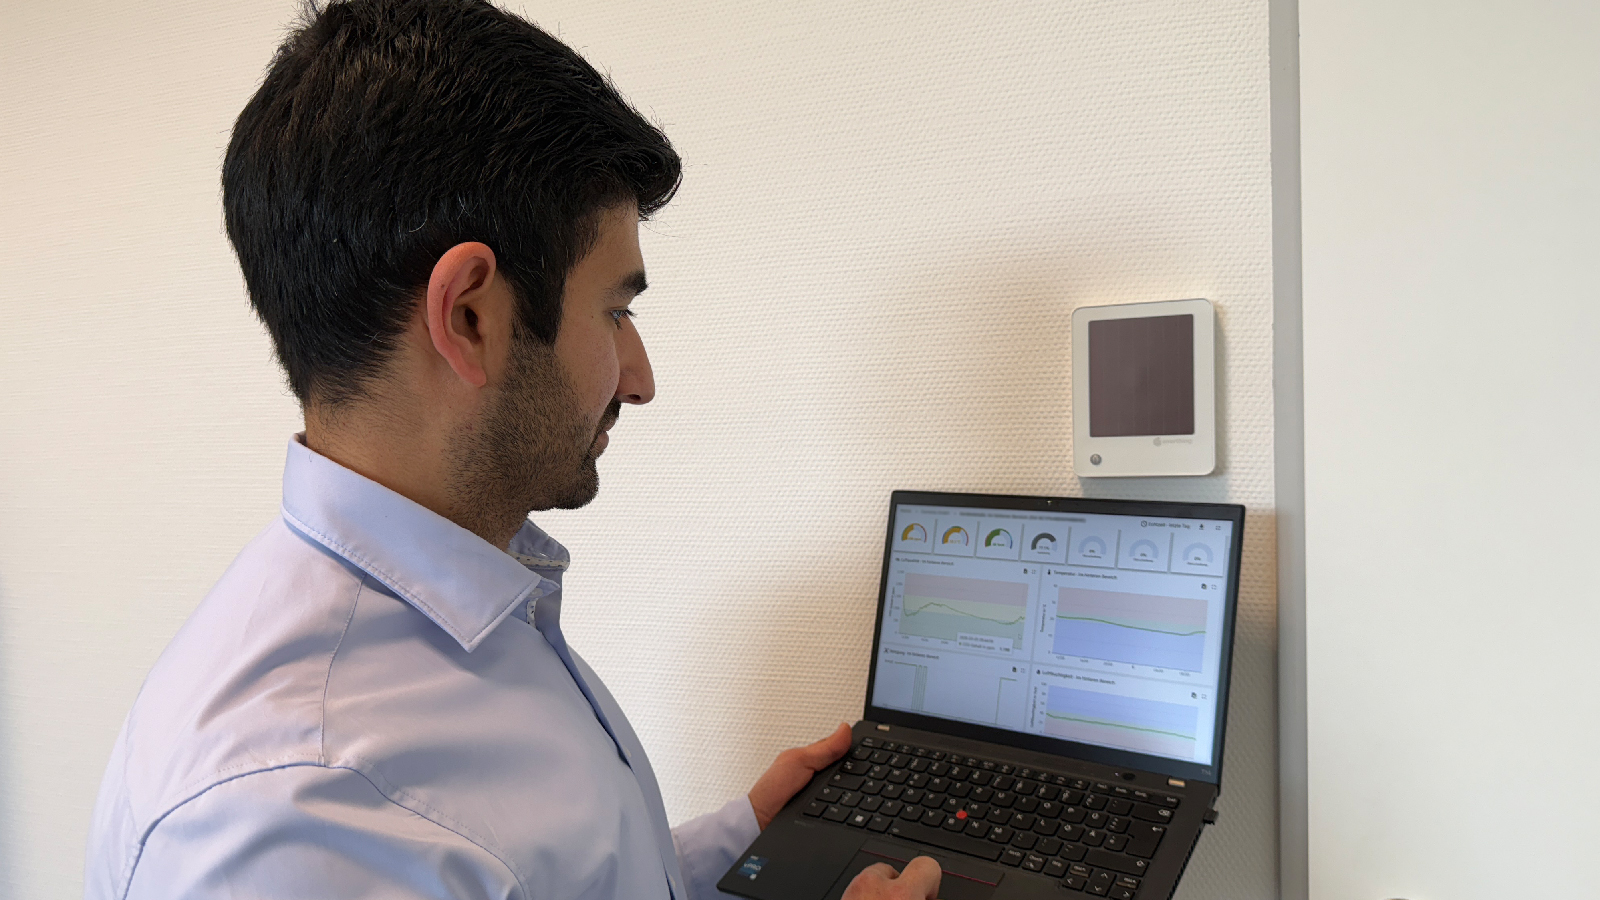
The benefit does not show up in the next full dashboard. It shows up when the facility team sees in the morning: Building B has been heating since 4 a.m., but is only used from 8 a.m. Smart Heating supports energy monitoring, makes heating profiles comparable and helps make the effects of measures visible. This makes digital building management tangible: less manual clarification, prioritized measures, traceable audit documentation and a robust basis for energy and ESG teams.
Why ISO 50001 requires robust heating data
ISO 50001 energy management requires a clear foundation: energy consumption must be measurable. Measures must be assessable. Improvements must remain traceable. In building operations, this requirement often fails not due to a lack of will. It fails due to the data situation.
Heating data arises in many places. It is found in meters, systems, building management technology, spreadsheets or manual reading processes. This creates effort, but not automatically transparency.
For energy management officers, this becomes particularly critical when they need to derive energy indicators, prioritize measures or answer audit questions. An annual or monthly consumption figure only shows the result. It does not show why the consumption occurred. Nor does it show whether an area was heated in line with its usage.
However, this level of causation is exactly what matters. Only those who recognize patterns can take effective countermeasures. These include permanently too-high room temperatures, incorrectly set time programs, or heated areas without current usage.
Smart Heating can close this gap. The solution makes heating behavior visible on a data basis. It does not replace internal assessment or normative consulting. However, it creates a robust factual basis. This enables energy, environmental and facility teams to better decide which measures make sense and how to demonstrate their effectiveness.
Which data really helps in energy management
Not every piece of information relieves energy management. What matters is data that answers concrete questions. Where does heating energy consumption arise? When does it arise? Does it match usage? And what changes after a measure is implemented?
Smart Heating connects heating operations, sensors and digital analysis. This includes consumption data, room temperatures, usage times, occupancy information and, depending on the use case, also data on humidity or outdoor temperature.
Consumption data shows how much energy was used. Temperature data shows whether heat arrives as needed. Usage data shows whether rooms are actually occupied. Outdoor temperatures help to put consumption fluctuations into context. This turns an isolated meter reading into a robust statement about efficiency, control and usage.
The value does not come from as many data points as possible. It comes from the right data points. A dashboard with unclear measurements relieves no one. What matters is that data directly matches questions from ISO 50001 energy management.
An example from building operations: The heating starts early because rooms should be warm in the morning. At the same time, part of the workforce works flexibly. Without digital data, it remains unclear whether heating times still match actual usage. With Smart Heating, it becomes visible when rooms are used, how quickly they heat up and which temperatures are actually reached.
This way, digital heating control does not become an end in itself. It becomes a tool for energy-efficient building management.
How Smart Heating practically supports ISO 50001
Smart Heating supports ISO 50001 processes especially where data is needed: in recording, assessing, implementing and reviewing measures. The solution improves the measurability of heating operations. It makes buildings and time periods comparable. And it simplifies the documentation of measure effectiveness.
With continuous data collection, teams do not have to wait until the next monthly evaluation. They recognize trends and deviations earlier. They see more quickly whether a building uses noticeably more energy, whether heating times do not match usage, or whether temperature curves deviate from the target.
The operational benefit lies in clarity. Many energy management systems define goals and measures clearly. The bottleneck occurs in daily follow-up. Are new heating profiles really being adhered to? Did an adjustment on the weekend show an effect? Do individual zones remain conspicuous despite a measure?
Digital heating data provides faster answers to this. It creates a common basis for energy management, facility management, environmental management and site management. This makes discussions more objective. Measures can be better prioritized. And investments can be justified more comprehensibly.
In practice, this can mean: Three office buildings with similar usage are compared by kWh per square meter and temperature curve. If building 2 is significantly above the others, it is first on the review list. Facility management then specifically checks controls, sensor positions, usage times or technical settings. This creates a structured process instead of examining each building individually and manually.
Relief for energy management and building operations
Manual data collection ties up valuable capacity. Teams read meters, transfer values, maintain spreadsheets and check plausibility. This effort costs time. It also means data is often available with a delay. As a result, teams react later to deviations and spend a lot of time on data maintenance instead of optimization.
Digital data collection changes this process. Sensors and connected meters deliver data automatically. Transmission occurs via suitable connectivity depending on the location, for example via LoRaWAN® for building management applications.
LoRaWAN® is particularly suitable for existing buildings. The radio technology enables long ranges and supports low-energy sensors. This often allows data points to be added without significantly affecting building operations.
This relieves not only energy management. Environmental management and ESG teams also benefit from a better data basis. They can track developments, reduce CO₂ emissions and prepare reports more thoroughly. Facility teams recognize anomalies earlier. If a room remains permanently too warm, the team does not have to wait for complaints or delayed consumption evaluations.
For companies with multiple buildings, an additional scaling effect arises. Data models, dashboards and interfaces defined once can be transferred to other areas. This way, the data basis grows in a controlled manner. At the same time, operations remain manageable, because not every building becomes its own special project.