
Challenge
No demand-based control
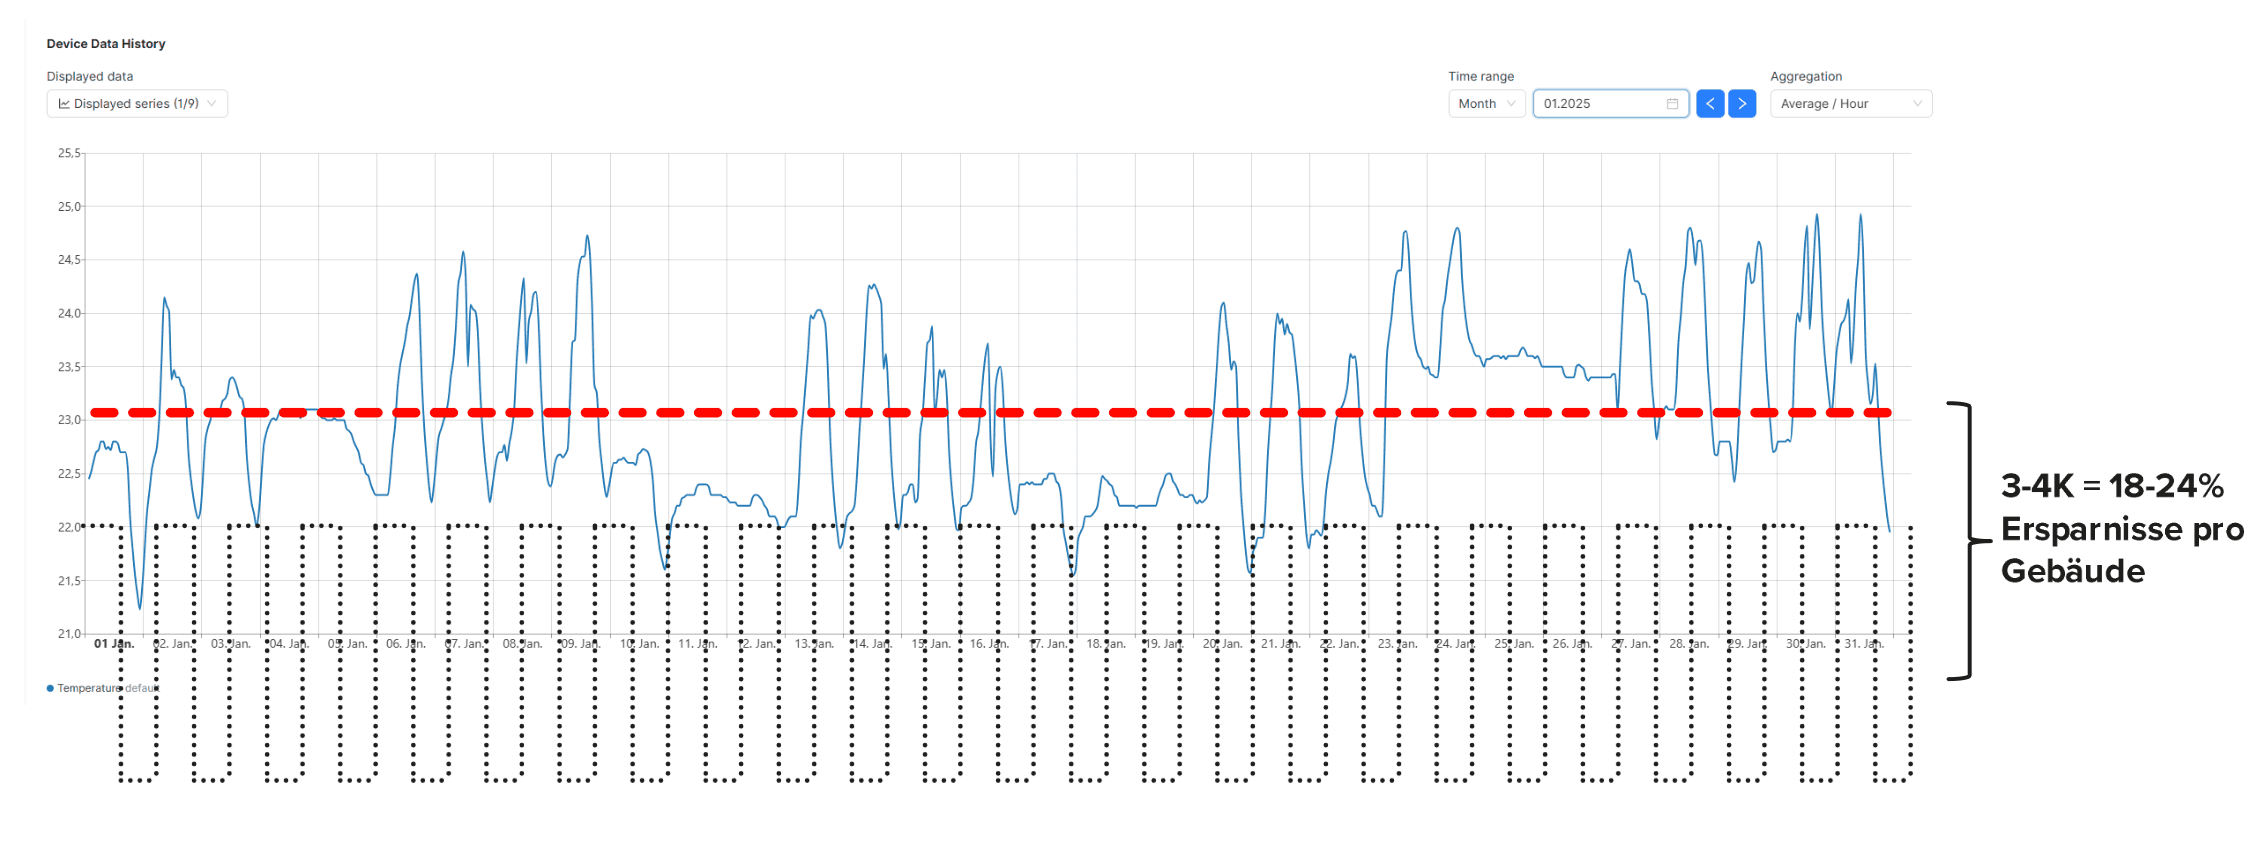
The heaters ran continuously at 22–24 °C — regardless of the time of day, the weather or whether anyone was home.
No indoor air quality monitoring
Neither temperature trends nor CO₂ or particulate matter levels were recorded or analyzed.
High energy consumption, no concern for CO₂ emissions
Large amounts of heating energy each year resulted in several tons of CO₂ — with no way to optimize or reduce it.
Flat-rate billing
Because of the flat-rate billing, more heat was used than necessary and the potential for savings went unnoticed.
Solution
Achieve sustainability goals through heating optimization and air quality tracking in just two weeks.
Retrofitting with smart heating actuators
16 actuators regulate the heating according to demand — based on temperature, occupancy and time profiles.
Sensors for CO₂, temperature, and particulate matter
Eight networked air quality sensors provide precise data for greater comfort, a better indoor climate and targeted ventilation.
Dashboard for Transparency and Control
A central dashboard displays temperature trends, operating hours, energy consumption and CO₂ levels for the 300-square-meter office space.
Efficient data transmission via LoRaWAN®
The integration of existing infrastructure (Conneqtive) enables secure and scalable connectivity — even for future buildings.