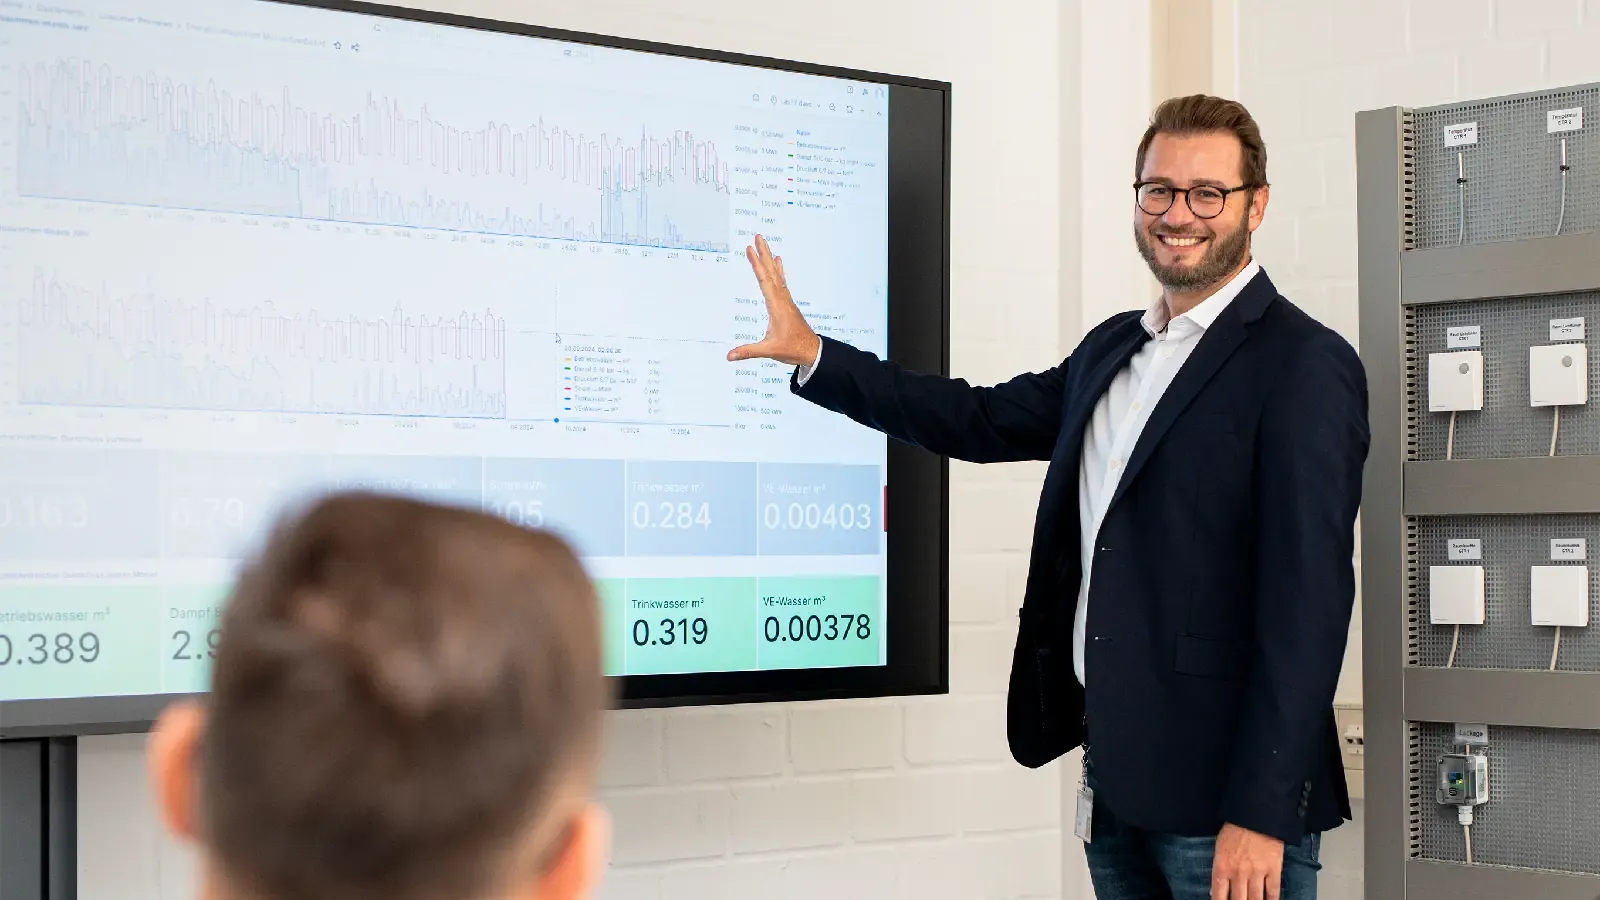
IoT solutions generate vast amounts of data that only become truly useful when presented in an understandable way. This is exactly where dashboards and visualizations come into play. They translate sensor data, status values, and consumption information into clear visuals, key metrics, and trends that can be quickly grasped in everyday use.
Whether it’s management, production, maintenance, or energy managers: Different roles require different views of the same data. A good dashboard turns complex IoT data into a foundation for decisions, priorities, and actions.
Why Visualization Is So Important in the IoT
Data alone does not create value. Only a structured presentation reveals what is currently happening, where deviations exist, and what trends are emerging.
Reducing Complexity
IoT data can quickly become overwhelming. Dashboards condense information so that it can be grasped at a glance.
Facilitating Decisions
When the relevant metrics are clearly visible, decisions can be made more quickly and with greater confidence.
Highlighting differences between roles
Management, production, and maintenance teams are often interested in different metrics. Visualization helps clearly map out these different perspectives.
What an IoT Dashboard Should Do
A good IoT dashboard is more than just a graphical interface. It must present the data in a way that makes it truly usable in day-to-day operations.
Show Relevant Metrics
A dashboard should display the metrics that are truly important for the specific use case. Too many values make it confusing.
Highlight trends and deviations
It’s not just the current status that’s relevant, but also how it evolves over time. Trends help identify problems or opportunities early on.
Be role-based
A dashboard for executive management looks different from one for maintenance. Good visualization takes these differences into account.
Which Types of Visualization Are Particularly Useful
Depending on the use case, different display formats may be appropriate.
Traffic Light and Status Indicators
They are well-suited for quickly and easily assessing statuses.
Trend curves and time series
They show developments over hours, days, or weeks and are particularly useful for analysis and root cause investigation.
Comparison and location views
When dealing with multiple facilities or locations, comparisons help highlight differences.
Alarm and event overviews
Important events must be clearly highlighted to ensure quick response times.
How dashboards benefit the industry
Faster response
When anomalies are visible, a faster response is possible.
Greater transparency
Dashboards provide a shared view of operational status. This improves collaboration between departments.
Simpler Communication
Complex data is easier to convey internally when it is visualized.
Greater Acceptance
When users see the benefits directly, acceptance of an IoT solution increases significantly.
Which Data Can Be Visualized Effectively
IoT dashboards are particularly useful when they consolidate data from other clusters.
Environmental metrics
Temperature, humidity, air quality, and other environmental data can be clearly displayed.
Consumption Data
Energy, utility, or resource data can be easily compared and analyzed in dashboards.
Status Data
Condition monitoring and predictive maintenance data benefit particularly from clear visualization.
Location data
Multi-site or brownfield applications can be structured particularly well using dashboards.
How this article differs from the other clusters
Not a sensor-related topic
This is not about data collection, but about data presentation.
Not an infrastructure topic
The technical foundation is covered on the infrastructure pillar page. This article focuses on the user level.
Not a detailed use case article
Dashboards can support many use cases, but they should not duplicate them. The focus is on the visibility and usability of data.
The role of the IoT System House in this context
The right view for the right user
A system integrator helps tailor dashboards to different roles and requirements.
Condensing data meaningfully
Not all raw data needs to be displayed directly. The added value often lies in effective processing.
The interface between technology and business units
Dashboards are often the point where technical data is translated into business decisions.
Questions companies should clarify in advance
Who will use the dashboard?
The target audience determines the depth, complexity, and presentation.
Which metrics are truly important?
A dashboard should display the data that actually influences decisions.
How often is the data needed?
Real-time data, daily overviews, and management reports require different visualizations.
What actions follow when anomalies are detected?
Without a clear response logic, a dashboard remains merely a display with no impact.
Conclusion
IoT dashboards and visualization are a key component for the practical benefits of industrial IoT solutions. They make data understandable, support decision-making, and ensure that sensor technology and analysis become part of everyday operations.